
TL;DR
Inflowave's analytics dashboard shows you the metrics that actually drive revenue - DM reply rates, lead conversion rates, pipeline velocity, campaign performance, and landing page behavior. Unlike Sprout Social or Hootsuite (which track vanity metrics like reach and engagement rate), Inflowave tracks the full journey from first message to closed deal.
The Problem With Traditional Instagram Analytics
Most Instagram analytics tools measure the wrong things:
- Reach - how many accounts your content was served to
- Impressions - how many times it was displayed
- Engagement rate - likes and comments divided by reach
- Story views - how many people tapped through
These metrics matter for content strategy. They don't tell you whether you're generating leads or closing business.
Sprout Social, Hootsuite, and Later are excellent for measuring content performance - but none of them track what happens after someone DMs you, submits your landing page, or enters your pipeline.
Inflowave analytics bridge the gap between content activity and business outcome.
What Inflowave Tracks
DM & Conversation Analytics
- New conversations started - how many people messaged you this period vs. the last
- Response rate - % of incoming DMs that got a reply (from your team or AI)
- Average response time - how quickly leads are being responded to
- Conversation outcomes - DMs that converted to pipeline cards, bookings, or sales
Campaign Performance
For each campaign (broadcast, comment trigger, DM sequence):
- Sent / delivered / failed counts
- Reply rate - % of recipients who responded
- Button tap distribution - which quick replies are performing best
- Revenue attribution - if a contact who received the campaign later closed, it's attributed
Pipeline Analytics
- Leads in each stage - current snapshot and trend over time
- Stage conversion rates - what % of "New Leads" reach "Proposal Sent"? What % close?
- Average time in stage - where are leads getting stuck?
- Pipeline value - total estimated value of all active deals
- Won vs. lost rate - by source, by team member, by campaign
Landing Page Analytics
Built into every Inflowave landing page:
- Sessions, unique visitors, time on page
- Conversion rate (form submissions ÷ visits)
- Traffic sources
- Heatmaps and session recordings
How to Read Your Analytics in Inflowave
Dashboard View
- Go to Dashboard in the left navigation
- Select your date range (7 / 30 / 90 days)
- Top metrics: New leads, messages sent, reply rate, pipeline conversions
- Charts: Lead source breakdown, campaign performance, team activity
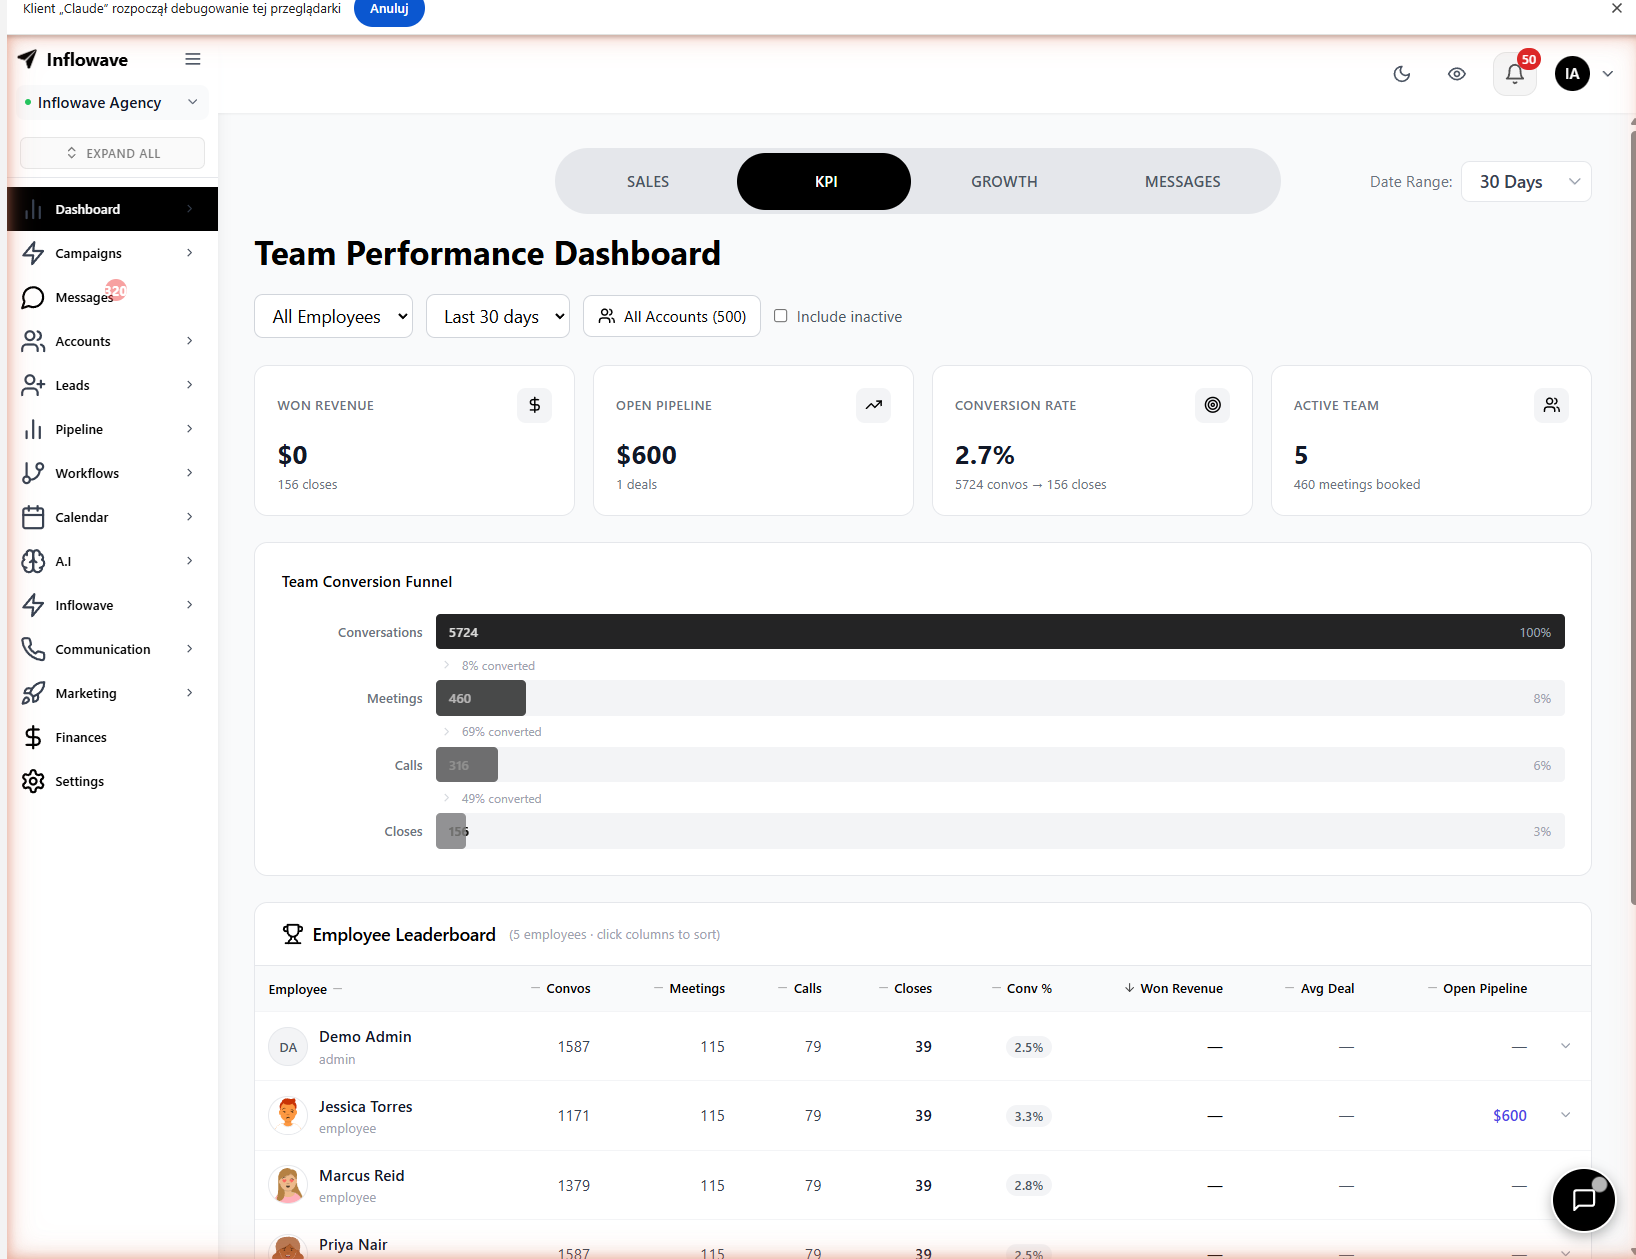
The Inflowave dashboard gives you a real-time KPI overview - new conversations, reply rates, leads generated, and pipeline conversions - all in one view with trend indicators.
Campaign-Level Analytics
- Go to Campaigns → click any campaign
- View full performance metrics for that campaign
- Click into any segment (e.g., "replied YES") to see the exact contacts who took that action
Pipeline Analytics
- Go to Pipeline → click Analytics tab
- View funnel conversion rates, average deal velocity, win/loss breakdown
- Filter by team member to see individual performance
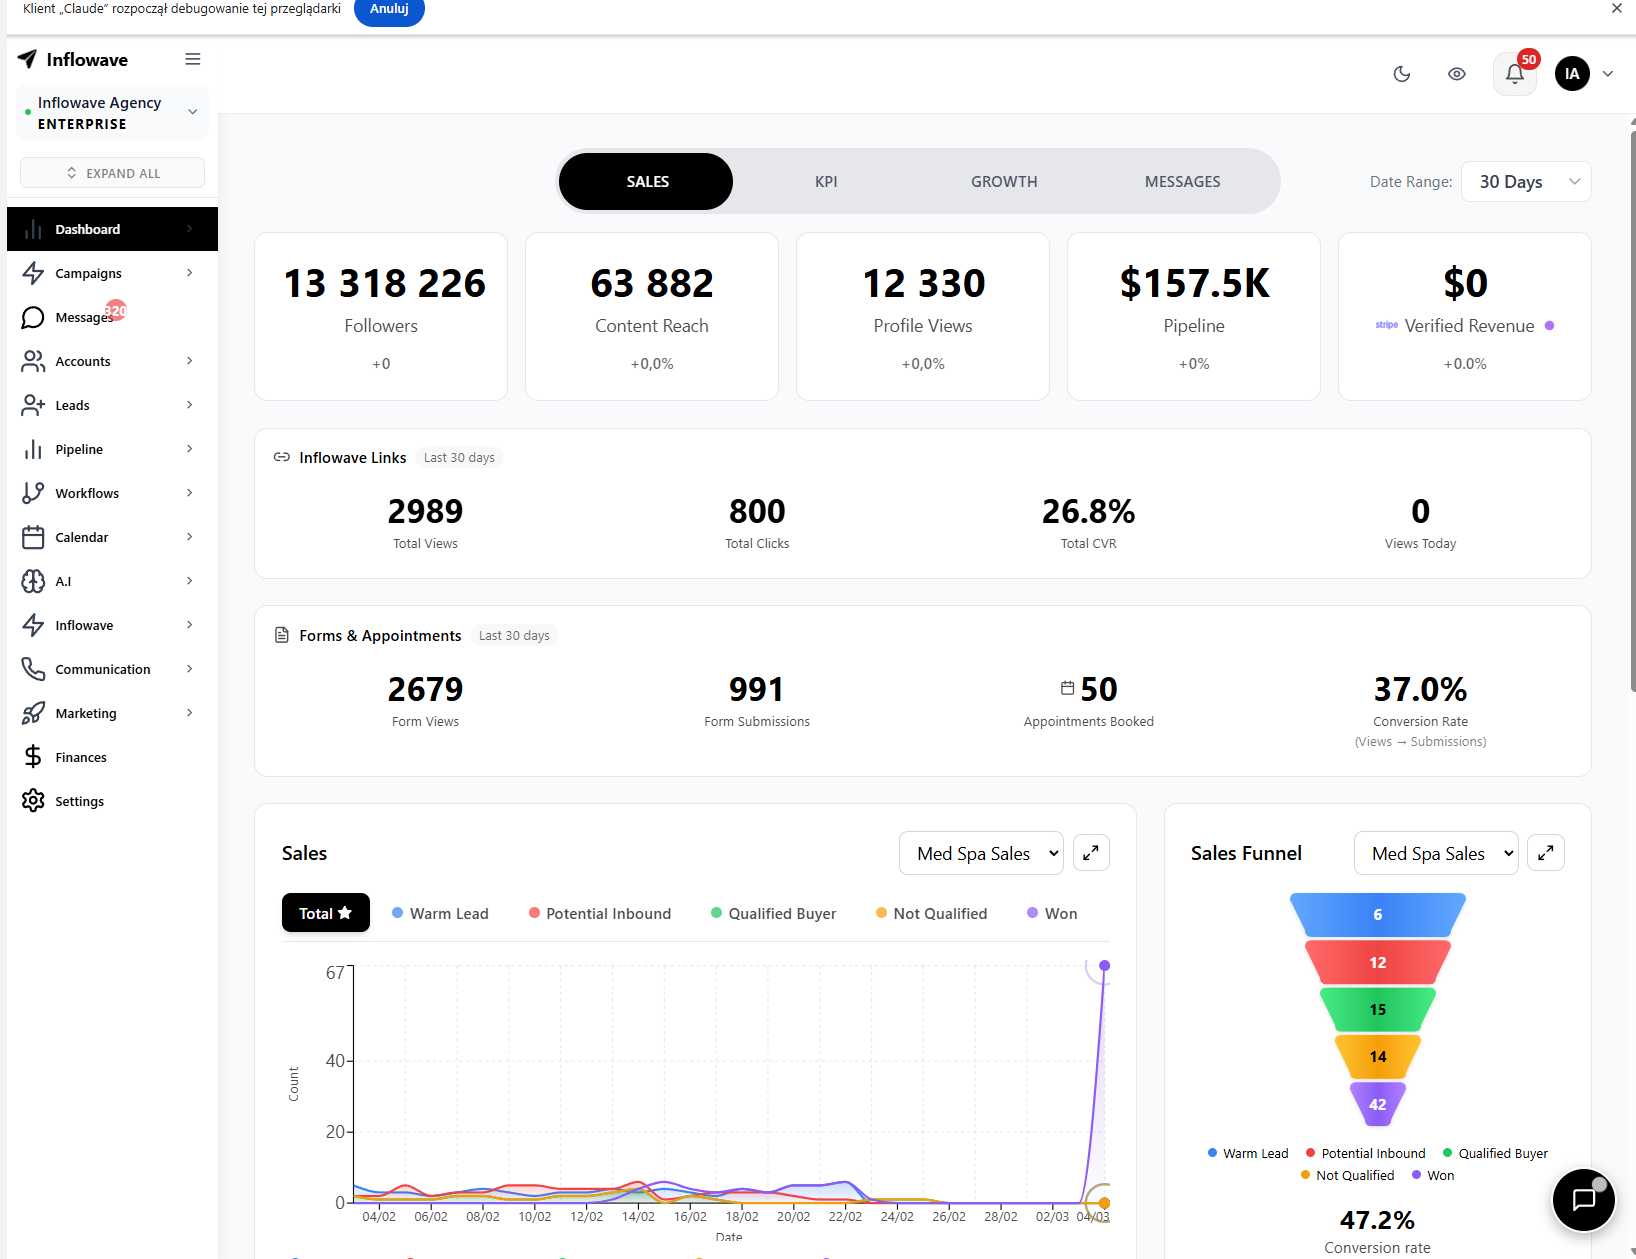
The advanced analytics view surfaces revenue attribution, follower growth across managed accounts, and campaign-to-revenue correlation - the metrics that matter for Instagram-driven businesses.
Inflowave Analytics vs. Sprout Social, Hootsuite, and Later
| Metric | Inflowave | Sprout Social | Hootsuite | Later |
|---|---|---|---|---|
| DM reply rates | ✅ | ❌ | ❌ | ❌ |
| Lead conversion tracking | ✅ | ❌ | ❌ | ❌ |
| Pipeline analytics | ✅ | ❌ | ❌ | ❌ |
| Campaign performance | ✅ | ✅ (social only) | ✅ (social only) | ✅ (social only) |
| Landing page analytics | ✅ | ❌ | ❌ | ❌ |
| Revenue attribution | ✅ | ❌ | ❌ | ❌ |
| Reach / impressions | ❌ | ✅ | ✅ | ✅ |
| Competitor benchmarking | ❌ | ✅ | ✅ | ✅ |
| Hashtag analytics | ❌ | ✅ | ✅ | ✅ |
The verdict: If you're a content creator focused on growing reach and engagement, Sprout Social or Later give you better content analytics. If you're a business that measures Instagram by revenue - leads generated, deals closed, pipeline velocity - Inflowave's analytics are purpose-built for that outcome.
Frequently Asked Questions
Can Inflowave track Instagram post reach and impressions?
Inflowave focuses on conversion-side analytics - DMs, leads, pipeline, and campaign performance. For reach, impressions, and follower growth, Instagram's native Insights or a tool like Later is more appropriate.
Can I export analytics data?
Yes. Inflowave supports CSV export for lead data, campaign results, and pipeline reports. This can be imported into spreadsheets or BI tools for deeper analysis.
Does Inflowave analytics work for multiple Instagram accounts?
Yes. Agency users can view analytics per account or aggregate across all managed accounts on a single dashboard.
Is Inflowave a good Sprout Social alternative?
For Instagram-specific analytics focused on lead generation and DM performance, yes. Sprout Social has broader social media coverage (LinkedIn, Twitter, Facebook) and deeper content analytics. Inflowave wins for DM-to-revenue tracking, pipeline analytics, and automation-linked attribution.
Conclusion
Vanity metrics are easy to find. Revenue metrics - how many DMs turned into leads, how many leads turned into customers - are what most Instagram analytics tools miss. Inflowave tracks the complete funnel from first touch to closed deal, which is exactly what growing Instagram businesses need.
Related Tutorials
- How to Set Up an Instagram Sales Pipeline
- Instagram Workflow Automation: Build Multi-Step Automations
- Instagram Scheduling Tool: Schedule Posts Inside Inflowave
- How to Set Up an Instagram AI Chatbot
Explore More
- Feature: Analytics Dashboard - Track Instagram metrics that actually matter
- Free Tool: Engagement Rate Calculator - Check any account's real engagement rate
- Free Tools - All free Instagram marketing tools
- Feature: AI CRM - Tie analytics to real revenue with Instagram CRM
- Compare: Inflowave vs ManyChat - Full-stack analytics vs chatbot-only